MSA
MSA>Utilities>Spectral sub SI
Current Function Version: 1.0 (Oct./30/'08)
Brief Description
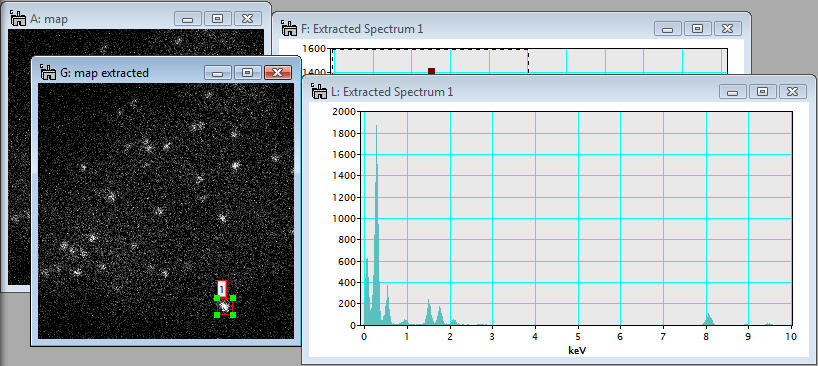
This function extracts a selected energy region from an existing 2D or 3D spectrum image and shows a new spectrum image with the selected energy region.
Usage
Open a 2D or 3D spectrum image and show a spectrum from the spectrum image using the SpectrumPicker tool
 in the tool bar. Next, select a energy range you want to extract from the existing spectrum image.
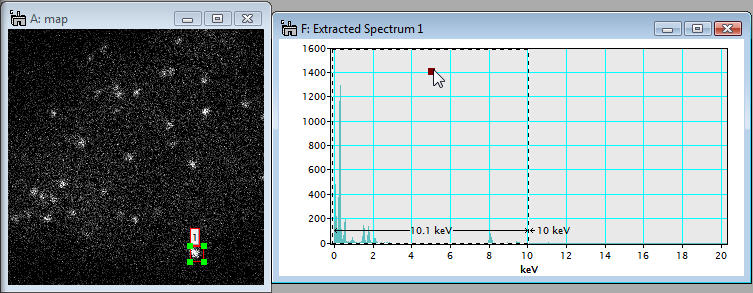
Then, select MSA>Utilities>Spectral sub SI from the menu bar. A new spectrum image with the selected energy range appears.