|
Parsing
files into spreadsheets
|
As
earlier, we recommend that while you are reading this material you activate
a spreadsheet and you try to go through the steps indicated in these notes.
Whenever things diverse from the presented sequence, stop, go to the top
and repeat the sequence.
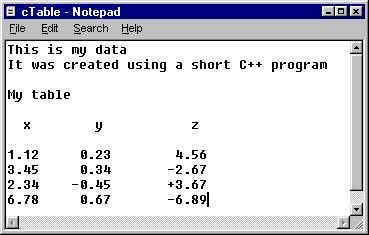
In the earlier section we learned how to create a graph if we have the data listed in our spreadsheet like a table. In many instances we may have a text file which contains such a table and which was generated using different software, for example a C++ program that we wrote. Our challenge in this section is to learn how we can use Excel to graph such "outside" data. Of course, what we need to do is transfer the contents of this text file into our spreadsheet and make sure that the columns of the table enter distinct columns of the spreadsheet so that we maintain the tabular character of the data. This transfer is called "parsing". Suppose that we have a file, which when viewed by notepad looks like this:

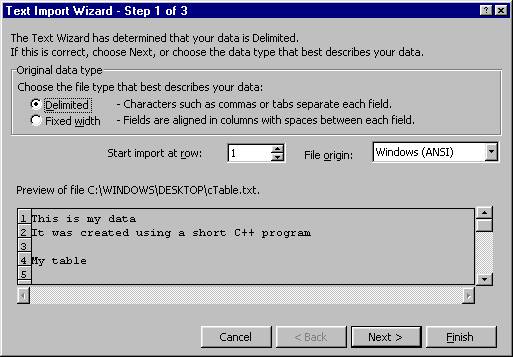
The name of the file is cTable.txt We will parse this file into Excel. From the File menu select Open, the Text Import Wizard will appear as shown below:

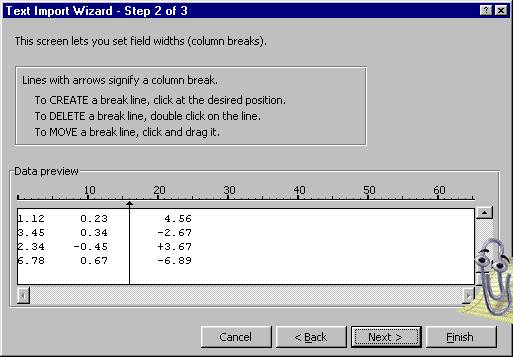
Change the number in the box of "Start import at row" to 8 so that you enter only the numbers to the spreadsheet, select Fixed-width from the choices up top and click on Next. We obtain the following window, which clearly indicates that the first two columns were jammed together into a single one.

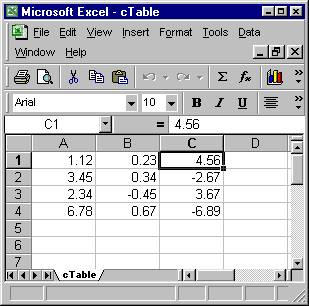
We can correct the error by clicking a line between the first and second column and we can then click Next. Make sure the dividing lines are at proper places. Don't loose the sign. From the next Wizard step select the format (general will do most of the time). Click on Finish. Remember to check the spreadsheet to make sure that the parsing took place correctly.
This is what we got:

Jacob Y. Kazakia © 2001 All rights reserved