Lehigh University
The Tribology Laboratory at Lehigh University
Research
Tribometry and instrumentation
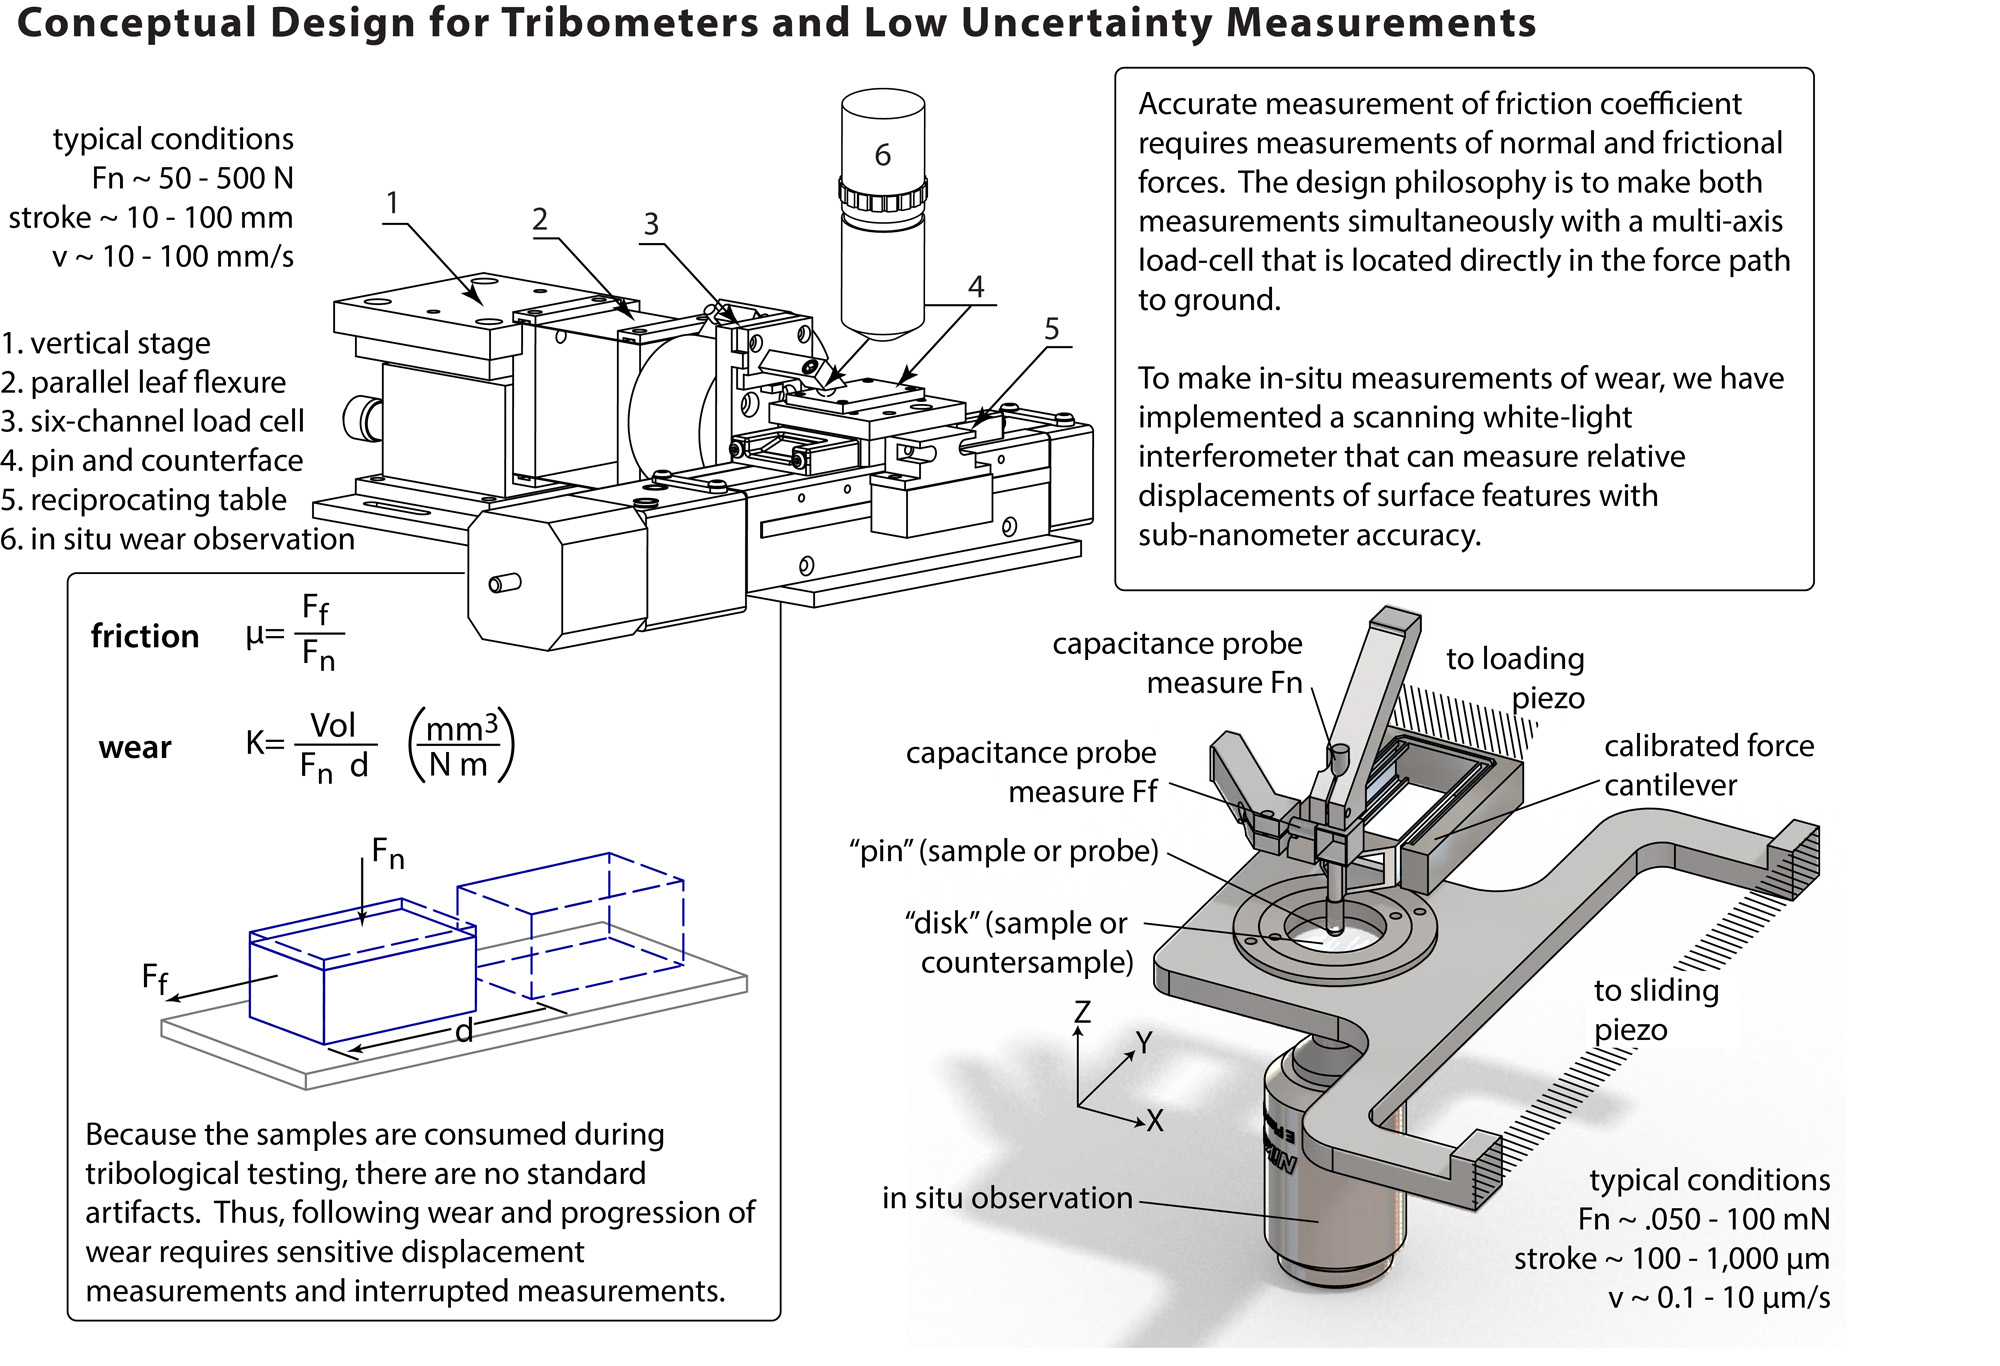
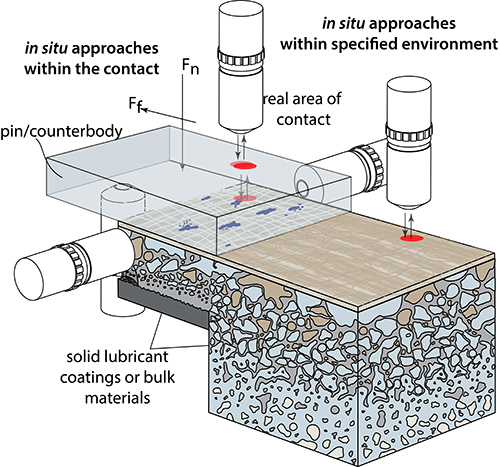
Conceptual Design of Tribometers and Experiments
Tribometry is the measurement of friction and wear of tribological systems as performed by a tribometer. Tribometers are the instruments used to evaluate a material’s tribological properties, including friction, wear and even adhesion, hardness and other contact mechanics.
It is also very important to point out that measurement practices and standards vary for different research groups. Direct comparison of results between various research groups should be considered carefully as friction coefficient and wear rates can be affected by the methods of which the measurements are made and the many parameters and conditions of sliding experiments. For this reason, it is best to make arguments of trends, unless all of the materials, parameters and conditions are matched closely, and even then, it may be best for a researcher to recreate an experiment to evaluate the material in their instruments for the best comparison.
Friction coefficient measurements
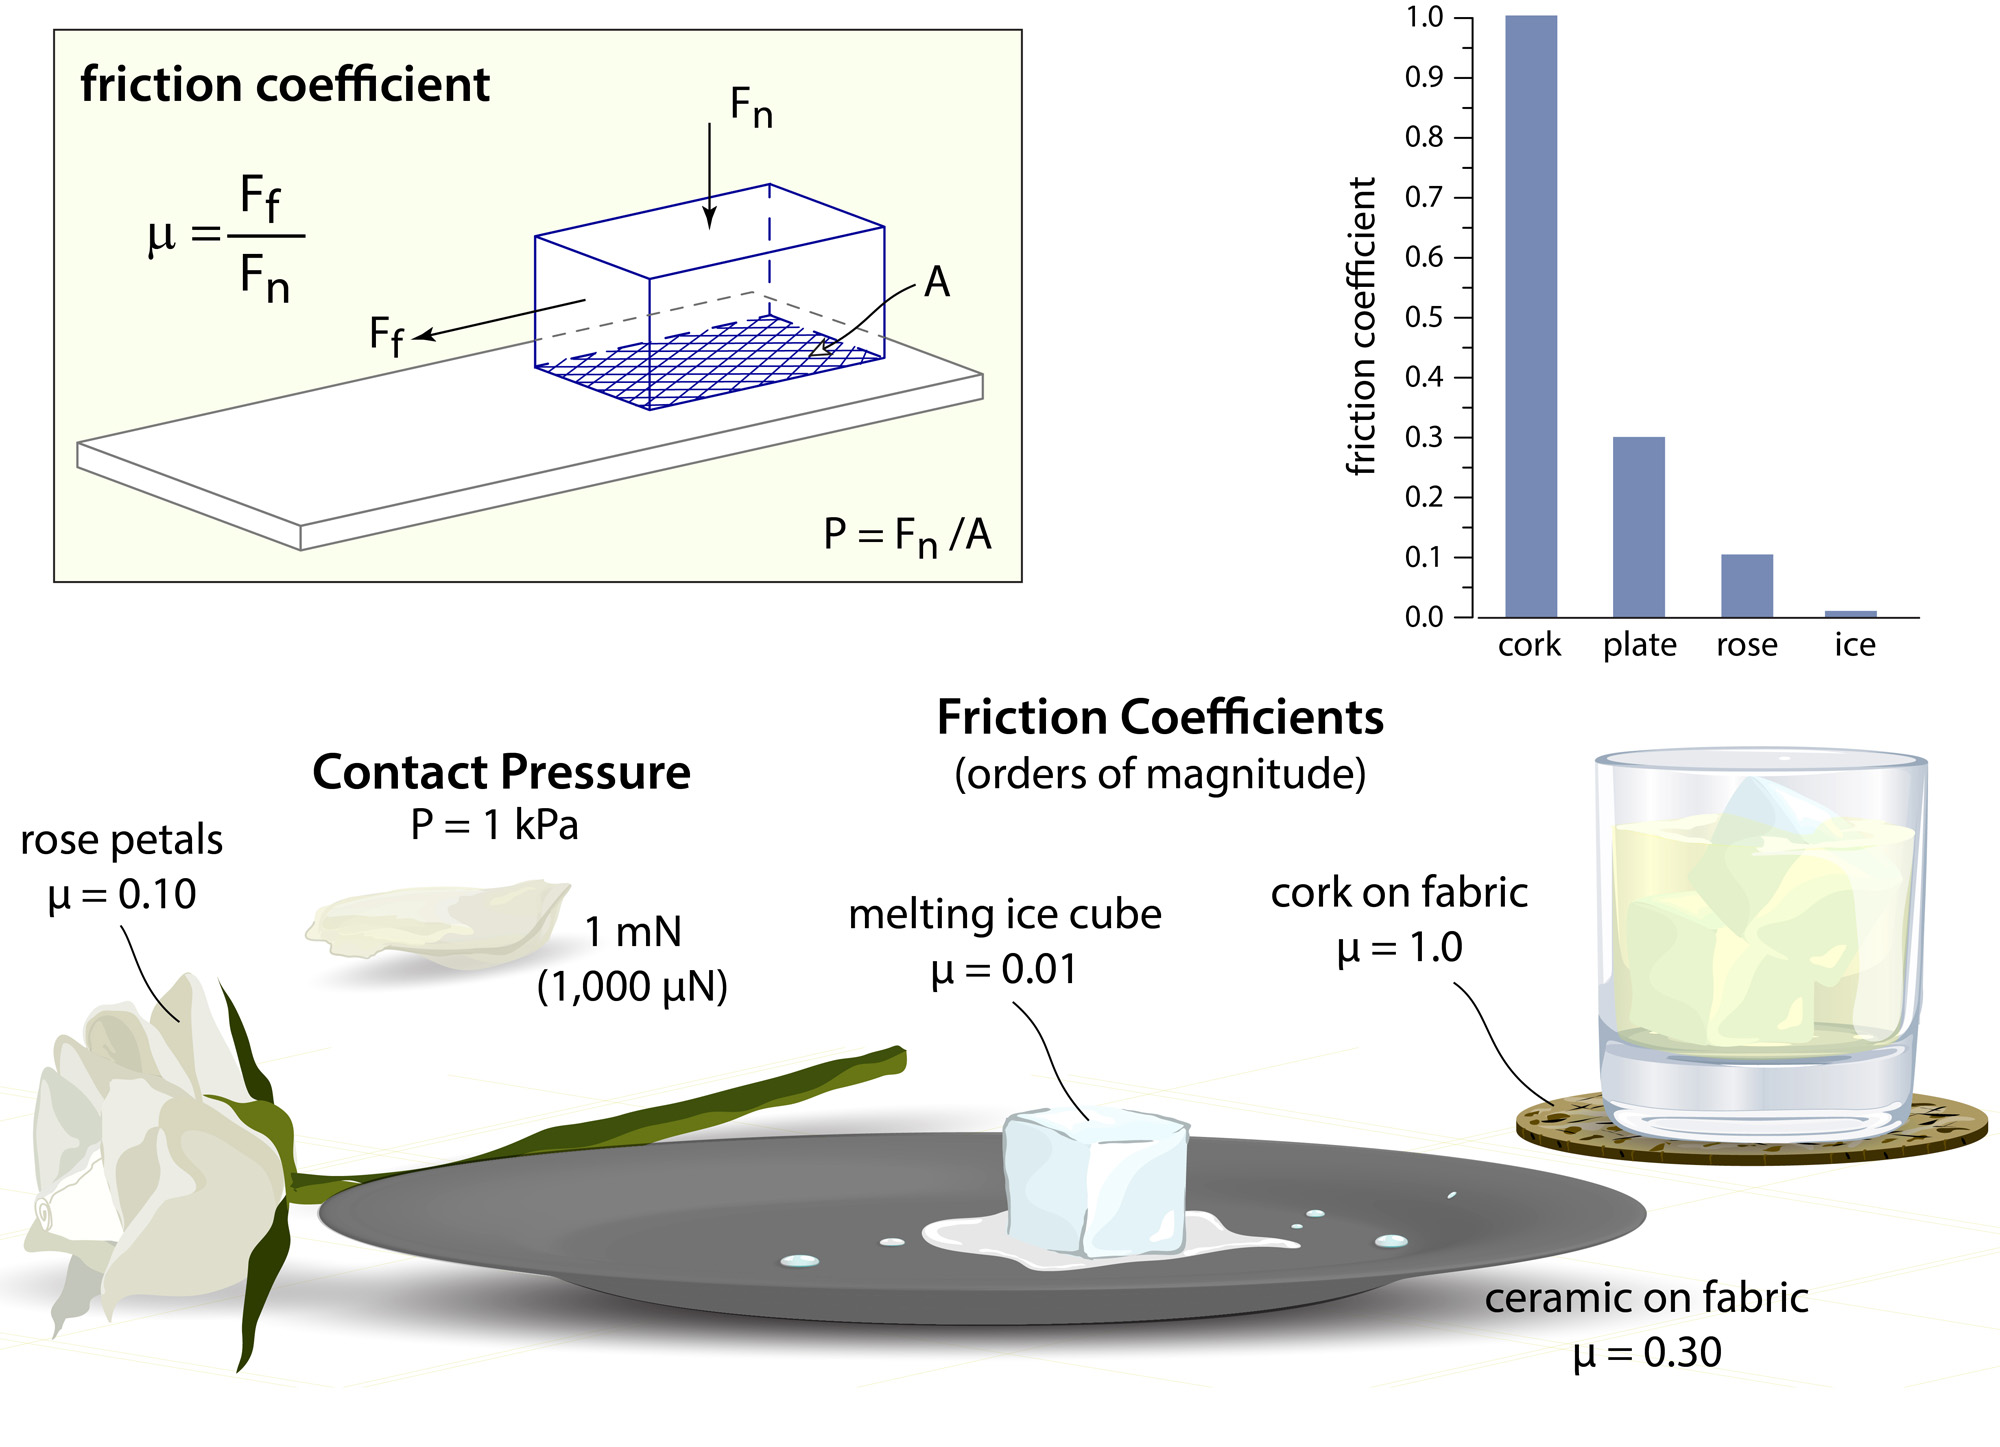
Friction coefficient is based on Amonton’s first law of friction, which states that the friction force, Ff, is directly proportional to the normal load, FN. A friction coefficient, µ, can then be defined by:
![]()
Friction coefficients are measured with a tribometer. Most modern tribometers apply a known normal load by mass or a measured normal load by an external loading system with a force transducer to measure the normal load. Friction forces are measured, and a friction coefficient can be determined. Schmitz et al. and Burris and Sawyer address the difficulties of measuring friction coefficient and the uncertainties associated with it [1, 2]. They conclude that misalignments with the transducer and the frictional and normal forces can produce errors, but these errors can be compensated by finding the instrument-related uncertainty of coefficient of friction and by performing sliding reversals to average out the error associated with the misalignment.
Wear rate measurements
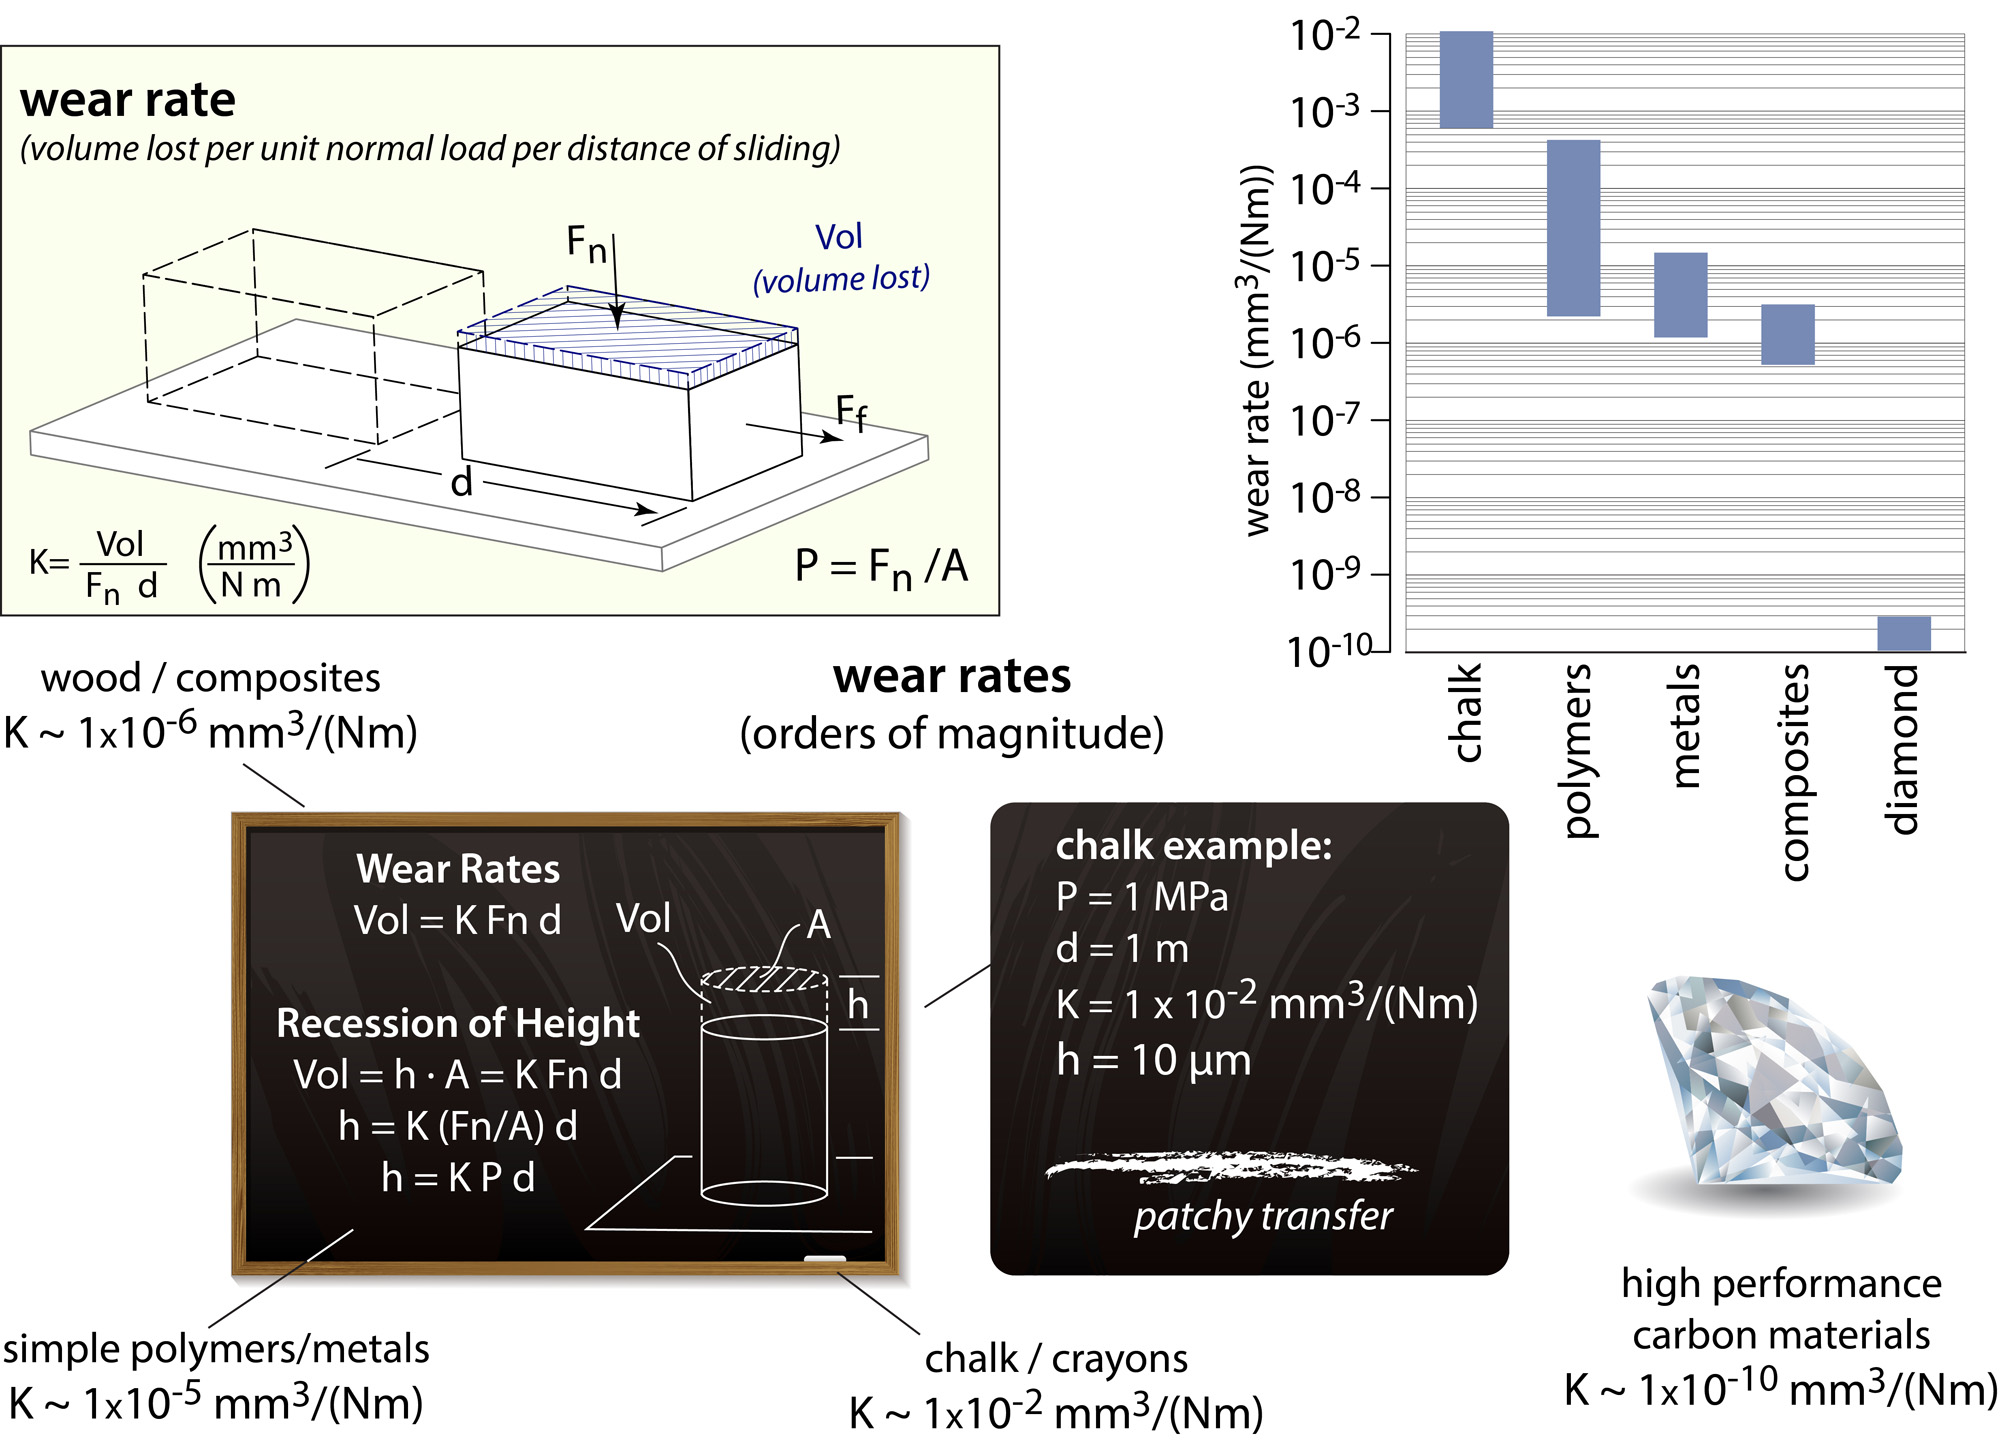
An accepted metric for reporting material wear was developed much later than that for friction coefficient. Archard and Holm suggested that the total volume of material removed during sliding (the wear volume), V, is proportional to the real area of contact multiplied by the sliding distance by the unit-less proportionality constant known as a wear factor, K [3-5]. This wear factor can be a property of the material set, sliding conditions, surface topography and environment, among other things. The wear factor can be manipulated to calculate the often more convenient and more physically direct specific wear rate [6] (also known as a dimensional wear rate [7]), k, commonly measured in units of mm3/Nm . The specific wear rate is simply the wear volume divided by the product of the normal load and the sliding distance, d, as shown:
![]()
There are numerous methods for making volume loss measurements used to compute wear rates. These measurements can be made directly, or volume losses can be inferred based on:
- dimensional changes in the material including height changes
- topographical measurements of a wear made by a profilometer such as:
- optical measurements (microscope, SEM, etc.)
- interferometric measurement (interferometer)
- stylus profilometry
- atomic force microscopy
- interrupted mass measurements
- inferred measurements based on the running through of a coating by observation of an increased friction coefficient
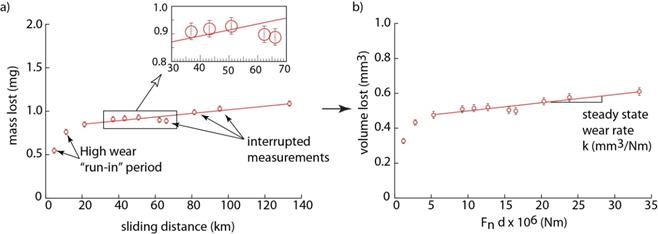
Interrupted mass measurements on a linear reciprocating tribometer were used for wear rates reported in this research. Using the material density, a volume loss can be calculated by a change in mass. Wear rates are easily calculated by:
![]()
Schmitz et al., Colbert et al. and Burris and Sawyer provide modern uncertainty analyses to several of the methods used in this research to find wear rates [1, 8, 9].
Example: A Linear Reciprocating Tribometer
A linear reciprocating tribometer is used in the Tribology Laboratory to perform wear experiments on polymeric materials. The tribometer is extensively discussed by Sawyer and Schmitz et al.[1, 10, 11]. Briefly, a polymer sample is mounted to a 6-channel load cell, which measures the normal and tangential forces. The polymer sample is then loaded against the counter sample (normally 304L stainless steel) with a normal load of 250 N). Normal load is applied and controlled by a pneumatic cylinder. Utilizing reversals, reported friction coefficients have an uncertainty of less than 0.005 [1]. This uncertainty is less than the fluctuating component of friction coefficient, which is a dynamic variation in the friction coefficient.
In this flat on flat configuration the nominal average contact pressure is approximately 6.3 MPa, which is roughly 20% of the yield strength of PTFE. The counter sample is mounted directly to a linear ball-screw stage, which reciprocated with a stroke of 25.4mm at a rate of 50.8 mm/s. Tribological sliding conditions are chosen to be the same as many studies [8, 10, 12-16] to match engineering conditions and for easy comparison.
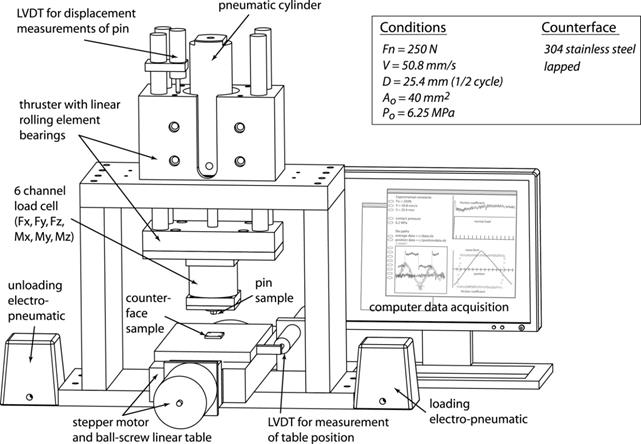
Normal and friction forces are measured through the 6-channel load cell as sliding reciprocations occur. During each sliding cycle, a friction loop is measured. This friction loop is periodically saved. More importantly, the friction loop is used to compute an average friction coefficient for that cycle along with a standard deviation in friction coefficient.
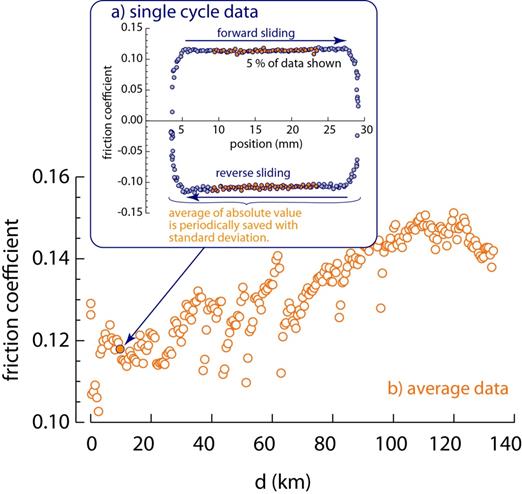
Average values and standard deviations of normal force, friction force, friction coefficient, linear pin wear, temperature and humidity are all measured on a cycle by cycle basis and saved periodically. This produces data of statistical significance, in which observation of friction coefficients and wear volumes can be made as a function of sliding distance. Tests often run for over one million cycles, which takes several weeks.
Interrupted mass measurements are taken to calculate wear measurements. For polymers like PTFE, the dimensional properties can change over time due to creep. Mass measurements provide much more reliable measurements of wear volume and wear rates. It is also common to observe a brief run-in period for PTFE composites in which the composites wear appreciably more than the steady state wear. Reported values of wear are the steady state wear rates, which are measured after the initial run-in period. Through both uncertainty analysis by both propagation of uncertainty and a Monte Carlo simulation developed by Burris and Sawyer [8], the uncertainty in wear rates for a representative experiment producing a wear rate of 1x10⁻⁷mm3/Nm is typically 1-5 x10⁻⁹mm3/Nm, which is smaller than the data points on the plots. For this reason, uncertainty is not reported.
For linear reciprocating tests, molded samples are usually machined into 6.3mm x 6.3mm x 12.7mm pins. One 6.3mm x 6.3 mm end of the pin was polished flat with 800 grit silicon carbide polishing paper to a roughness of Ra ≈ 100nm. Samples are then sonicated in methanol for 30 minutes. After sonication, samples are dried for three hours in laboratory to ensure evaporation of methanol before recording an initial mass measurement.
Standard metal countersamples are 304L stainless steel rectangular flat plates (38mm x 25mm x 3.7mm) with an average roughness Ra ≈ 150nm for most experiments. The effects of counter sample roughness on the wear properties of this material have been studied and further information regarding this surface are discussed by Burris and Sawyer [12]. Counter samples are washed with soap and water, followed by methanol. New samples and countersamples are used for each sliding experiment.
1. Schmitz, T.L., et al., The difficulty of measuring low friction: Uncertainty analysis for friction coefficient measurements. Journal of Tribology-Transactions of the Asme, 2005. 127(3): p. 673-678.
2. Burris, D.L. and W.G. Sawyer, Addressing practical challenges of low friction coefficient measurements. Tribology Letters, 2009. 35(1): p. 17-23.
3. Archard, J.F., Contact and rubbing of flat surfaces. Journal of Applied Physics, 1953. 24(8): p. 981-988.
4. Archard, J.F., Single contacts and multiple encounters. Journal of Applied Physics, 1961. 32(8): p. 1420-&.
5. Holm, R. and E. Holm, Electric contacts handbook. 1958, Berlin: Springer.
6. Stachowiak, G.W. and A.W. Batchelor, Engineering tribology. 2005, Oxford: Elsevier.
7. Williams, J.A., Engineering tribology. 1994, Oxford: Oxford University Press, Inc.
8. Burris, D.L. and W.G. Sawyer, Measurement uncertainties in wear rates. Tribology Letters, 2009. 36(1): p. 81-87.
9. Colbert, R.S. and W.G. Sawyer, Thermal dependence of the wear of molybdenum disulphide coatings. Wear, 2010. 269(11-12): p. 719-723.
10. Sawyer, W.G., et al., A study on the friction and wear behavior of PTFE filled with alumina nanoparticles. Wear, 2003. 254(5-6): p. 573-580.
11. Schmitz, T.L., et al., Wear-rate uncertainty analysis. Journal of Tribology-Transactions of the Asme, 2004. 126(4): p. 802-808.
12. Burris, D.L. and W.G. Sawyer, Tribological sensitivity of PTFE/alumina nanocomposites to a range of traditional surface finishes. Tribology Transactions, 2005. 48(2): p. 147-153.
13. Burris, D.L. and W.G. Sawyer, Improved wear resistance in alumina-PTFE nanocomposites with irregular shaped nanoparticles. Wear, 2006. 260(7-8): p. 915-918.
14. Burris, D.L. and W.G. Sawyer, Tribological behavior of PEEK components with compositionally graded PEEK/PTFE surfaces. Wear, 2007. 262(1-2): p. 220-224.
15. Burris, D.L., Investigation of the tribological behavior of polytetrafluoroethylene at cryogenic temperatures. Tribology & Lubrication Technology, 2008. 64(5): p. 40-50.
16. Burris, D.L., et al., A route to wear resistant PTFE via trace loadings of functionalized nanofillers. Wear, 2009. 267(1-4): p. 653-660.
